Financial Tools
How to Calculate SIP Returns Before Investing
Estimate SIP maturity, compare lumpsum outcomes, and read year-wise growth before you invest. UseBoldTools runs all calculations locally in your browser.
By UseBoldTools Team 9 min readPublished July 2, 2026

Introduction
Before you commit to a monthly SIP, you deserve a clear picture of what that habit could build over five, ten, or twenty years. A headline return percentage from a fund factsheet is not enough—you need to see invested capital versus estimated gains, understand how tenure changes the curve, and compare a disciplined monthly plan against a one-time lumpsum if you have cash on hand today.
This guide explains how to calculate SIP returns before investing with the free SIP Calculator on UseBoldTools. You will walk through SIP and Lumpsum modes, read the projected outcome panel with its donut chart, explore step-up and inflation options, and use the year-wise breakdown to see how compounding accelerates over time. Everything runs locally in your browser—no account and no server upload.
If you are planning backward from a corpus target rather than forward from a monthly amount, read our how much you should invest every month to reach your goal guide after this one. For long-term wealth habits, see how to achieve financial freedom with SIP investing. More financial walkthroughs live on the UseBoldTools blog.
What the SIP Calculator does
UseBoldTools SIP Calculator is a browser-first planning workspace—not a brokerage or fund recommendation engine. It estimates mutual fund SIP maturity under your chosen assumptions, shows total invested capital and estimated returns separately, and visualizes the split with an on-page donut chart so you can see how much of the final number comes from contributions versus growth.
Two calculator modes sit at the top of the tool card: SIP for recurring monthly contributions and Lumpsum for a one-time investment over the same return and tenure assumptions. That side-by-side view helps answer a common pre-investment question: “If I invest ₹5 lakh today versus ₹10,000 every month, which path looks stronger under the same expected return?”
Beyond the headline maturity value, Advanced Options unlock step-up SIP (annual percentage or fixed rupee increases), goal-based monthly SIP (work backward from a target amount), and inflation adjustment (real value in today’s money). A collapsible year-wise breakdown table lists invested capital, portfolio value, and gain for each year so you can inspect the journey—not just the destination.
When you need to estimate SIP returns first
- Starting your first SIP. You know you can spare ₹5,000 or ₹15,000 monthly but want to see what that becomes before registering a mandate.
- Comparing fund categories. You might assume 10% for a balanced fund and 12% for an equity fund—running both scenarios takes seconds and frames realistic expectations.
- Salary hikes and step-up planning. A flat monthly SIP for twenty years may understate what you can afford after promotions; step-up mode models annual increases.
- Lumpsum versus SIP decisions. A bonus, inheritance, or sale proceeds might be better invested upfront or staggered—Lumpsum mode gives a quick comparison under identical return assumptions.
- Loan versus invest trade-offs. Pair SIP estimates with the EMI Calculator when deciding whether to prepay debt or continue investing—both tools use browser-local math.
Households juggling multiple goals—education, home down payment, retirement—often run several scenarios with different tenures. The calculator updates instantly as you drag sliders, which makes iteration faster than spreadsheet formulas for most users.
Step-by-step: calculate SIP returns before you invest
Open SIP Calculator in any modern browser. The page loads a single tool card with SIP selected by default—no sign-in required.
- Set monthly investment. Type a rupee amount or drag the slider (₹500–₹2,00,000 range). The projected outcome panel updates immediately on the right.
- Choose expected annual return. Enter a percentage (0–35%) or use the slider. Try conservative and moderate assumptions—12% is a common planning default for long-term equity SIPs, but your fund category may differ.
- Pick time period in years. Duration from 1 to 40 years strongly affects compounding. Notice how gains grow faster in later years on the year-wise table.
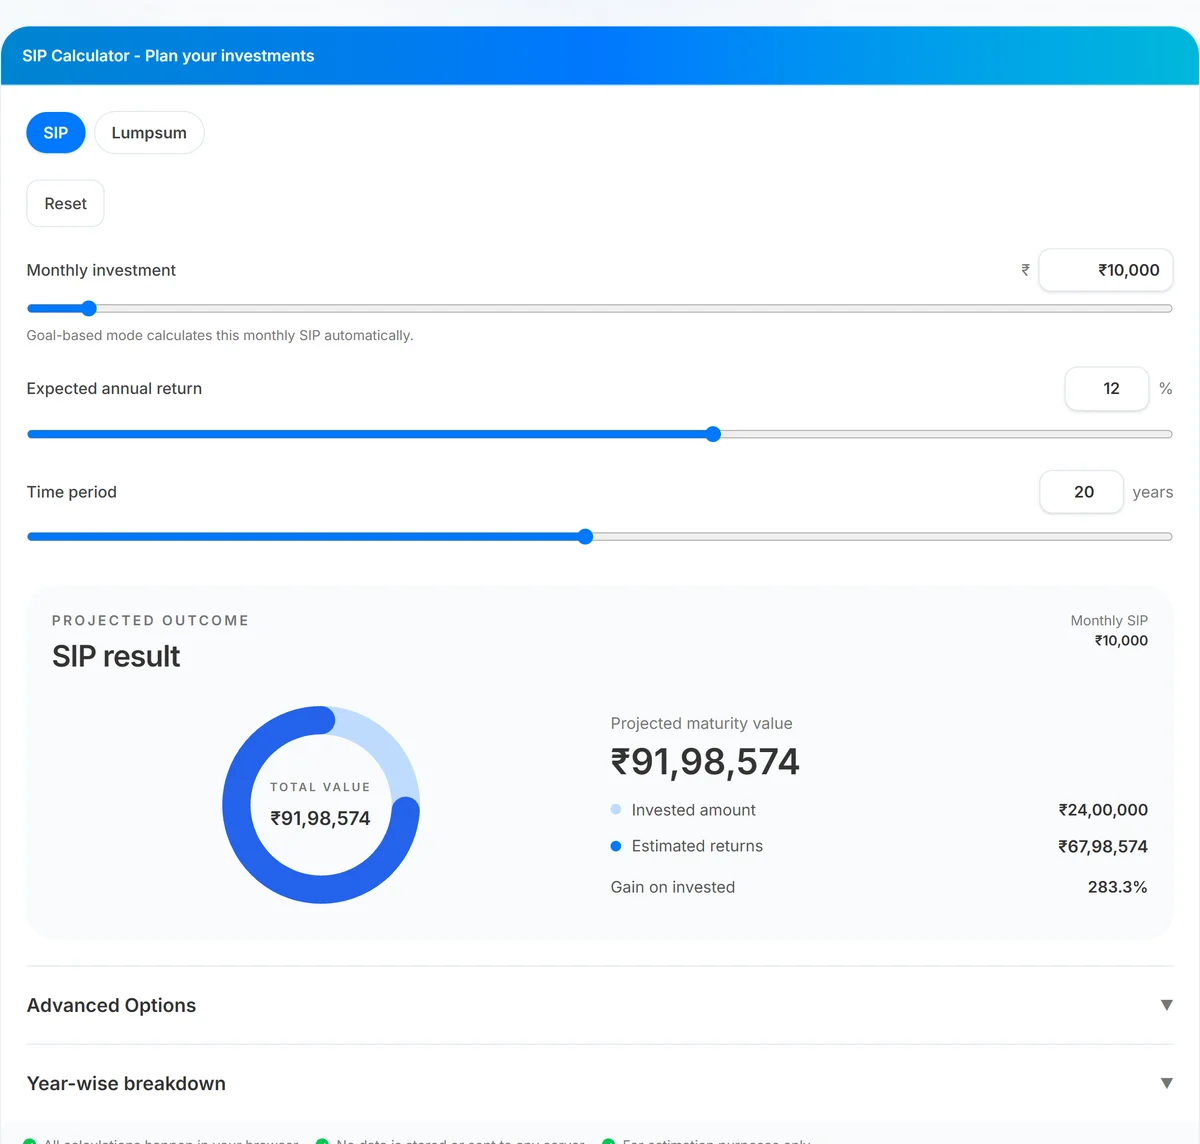
- Read projected outcome. The donut chart shows total value at the center with invested amount (light blue) and estimated returns (dark blue) in the legend. Check gain-on-invested percentage below.
- Compare Lumpsum mode (optional). Switch to Lumpsum, enter a one-time amount, and compare projected value under the same return and tenure.
- Open Advanced Options (optional). Enable step-up SIP, goal-based planning, or inflation adjustment when those questions matter for your decision.
- Review year-wise breakdown. Expand the table to see how invested capital and value build each year—useful for spotting when your plan “accelerates.”
How to read the results panel and charts
The right column labeled Projected outcome is your decision dashboard. Total value is the estimated maturity corpus. Invested amount is the sum of every monthly contribution (or the lumpsum principal). Estimated returns are the gap between those two—what compounding added on paper under your assumption.
The donut chart is not decorative. A thin gains ring early in a long tenure is normal—most of the corpus in year five might still be money you contributed. By year fifteen or twenty, the dark blue returns slice should widen if your return assumption holds. That visual shift is why tenure matters as much as monthly amount.
Planning notes appear when the tool detects aggressive assumptions—for example, inflation equal to or above expected return, or a goal-based SIP that requires an unusually high monthly commitment. Treat those notes as sanity checks, not rejections of your plan.

Benefits of estimating returns before you invest
- Realistic commitment sizing. Seeing that ₹8,000 monthly may reach roughly ₹76 lakh in 20 years at 12% (hypothetically) helps you choose a sustainable amount—not one you abandon after three months.
- Fewer surprises at review time. Annual statements make more sense when you already modeled invested versus growth components.
- Faster what-if analysis. Sliders beat rebuilding spreadsheet formulas when you test +2% return or +5 years tenure during a family planning conversation.
- Step-up visibility. Modeling a 10% annual SIP increase shows how income growth can materially change outcomes without requiring a heroic starting amount.
- Inflation context. Nominal maturity can look impressive while purchasing power tells a quieter story—enabling inflation adjustment adds that lens before you invest.
Investors tracking portfolio CAGR over time can later validate assumptions with the CAGR Calculator when comparing actual fund performance to the estimate you used today.
Privacy and security
Financial planning inputs feel personal. UseBoldTools SIP Calculator processes every figure in your browser tab. Monthly investment, return assumptions, tenure, step-up settings, and goal targets are not uploaded to our servers for calculation or storage.
A footer strip on the tool card states this explicitly: calculations happen locally, no data is stored or sent, and output is for estimation only. Close the tab when finished on a shared device. The calculator does not connect to your bank, broker, or mutual fund account.
This is planning math—not investment advice. Returns are hypothetical; market-linked products carry risk. Consult a qualified adviser for portfolio selection and tax treatment specific to your situation.
Common mistakes when calculating SIP returns
- Using one optimistic return for every fund type. Debt, hybrid, and equity categories behave differently. Run a range instead of a single hero number.
- Ignoring inflation on long goals. A ₹1 crore headline in 2046 is not the same as ₹1 crore today—enable inflation adjustment for retirement and education horizons.
- Comparing beginning-of-month SIP to end-of-month calculators elsewhere. UseBoldTools assumes contributions at the start of each month, which slightly increases projected maturity versus end-of-month tools.
- Treating estimates as guarantees. Expense ratios, taxes, and market volatility are not modeled here.
- Skipping tenure sensitivity. Adding five years often changes outcomes more than adding ₹2,000 monthly—always test duration.
- Forgetting step-up when income rises. A flat SIP forever may undershoot what your salary path could support; see how to achieve financial freedom with SIP investing for habit-building context.
Best practices
- Run three return scenarios (conservative, base, optimistic) and plan contributions against the conservative case.
- Match tenure to the actual goal date—child education in 12 years should not use a 25-year slider “just to see a bigger number.”
- Use goal-based mode when you know the target corpus; use forward SIP mode when you know your monthly budget.
- Export mental notes from the year-wise table: note which year invested capital crosses 50% of total value—that is when compounding visibly takes over.
- Revisit estimates yearly after salary changes rather than setting and forgetting a decade-old assumption.
- Bookmark SIP Calculator alongside EMI Calculator if you are balancing EMIs and investments in the same household budget.
Conclusion
Calculating SIP returns before you invest turns a vague “I should start something” into a number you can commit to—or adjust with confidence. UseBoldTools SIP Calculator gives you SIP and Lumpsum modes, instant charts, step-up and inflation options, and a year-wise breakdown without leaving your browser or creating an account.
Open SIP Calculator, enter your monthly amount, return assumption, and tenure, and read the projected outcome before you register your first mandate. Explore more guides on the UseBoldTools blog.
Frequently asked questions
How do I calculate SIP returns before investing?
Enter your monthly investment, expected annual return, and tenure in years on the UseBoldTools SIP Calculator. The tool instantly shows projected maturity value, total invested capital, estimated gains, and a donut chart split between invested amount and returns.
What return rate should I use for SIP estimates?
Use a conservative assumption based on the fund category you plan to invest in. Equity-oriented funds have historically delivered higher long-term averages than debt funds, but past performance is not a guarantee. Testing 10%, 12%, and 14% side by side helps you see a realistic range.
Does the calculator include step-up SIP?
Yes. Open Advanced Options, enable Step-up SIP, and choose an annual percentage increase or a fixed rupee increase. The year-wise breakdown table updates to reflect higher contributions over time.
Is SIP return calculation the same as actual mutual fund returns?
No. The calculator assumes a steady annual return compounded monthly. Real mutual funds fluctuate, charge expense ratios, and may include taxes on redemption. Treat the output as a planning estimate, not a promise.
Are my SIP inputs stored on UseBoldTools servers?
No. All calculations run in your browser. Your monthly amount, return assumption, and tenure are not sent to or stored on our servers.
Related guides
How to Achieve Financial Freedom with SIP Investing
Build a long-term SIP plan for financial freedom with step-up contributions, inflation-adjusted views, and year-wise growth—all calculated locally in your browser.
How Much Should You Invest Every Month to Reach Your Goal?
Find the monthly SIP required for your target corpus with goal-based planning, step-up SIP, and inflation context—calculated locally in your browser.
Related tools
Ready to try SIP Calculator?
Use our free SIP Calculator tool in your browser — no account required for most workflows.
Open SIP Calculator